Takeaway
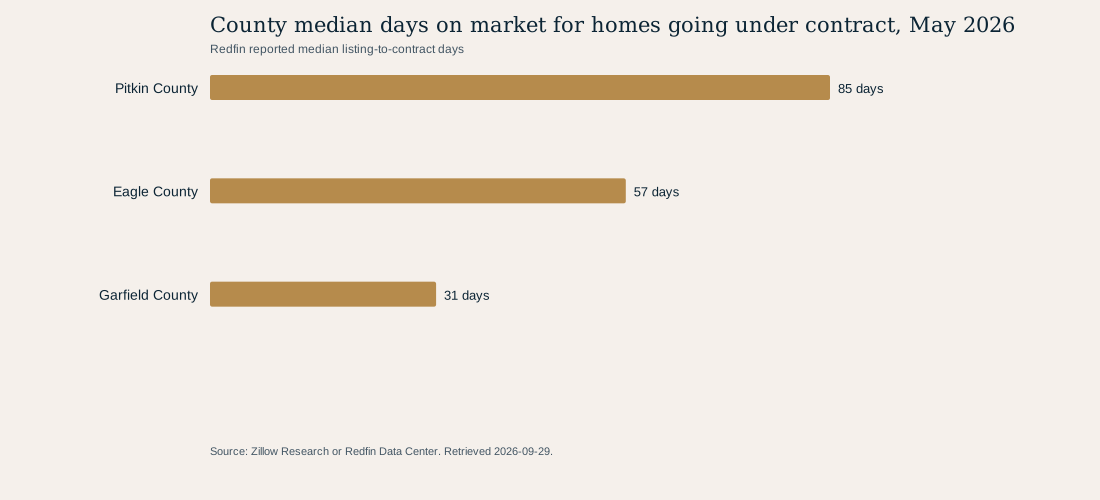
In May 2026, Redfin reported a 85 median days on market for homes going under contract in Pitkin County, versus 267 in May 2019. This broad county metric does not describe the expected selling time for a specific Aspen property.
Geography
Pitkin, Eagle and Garfield counties, Colorado. Broad county context, not city or property-specific market time.
Population
Redfin All Residential county aggregates for Pitkin, Eagle and Garfield counties, Colorado. The comparison uses the two month-end observations per county shown in the table.
Evidence basis
Six county-month observations: three counties × May 2019 and May 2026.
County median days on market for homes going under contract, May 2026
Unit: Redfin reported median listing-to-contract days
Redfin median days on market for homes going under contract
| County | May 2019 | May 2026 | Change |
|---|---|---|---|
| Pitkin County | 267 | 85 | -182 days |
| Eagle County | 126 | 57 | -69 days |
| Garfield County | 72 | 31 | -41 days |
Median days on market is Redfin's listing-to-contract measure for homes going under contract during the period; it excludes listings more than one year old.
Timing is not a promise
Median days on market is Redfin's listing-to-contract time measure for homes going under contract during the period, separate from active supply and sale price. A median says where the middle reported observation falls; it does not predict an individual home's time to contract.
The same-month comparison reduces seasonal mismatch but does not control for property mix, pricing, condition, or changes in reporting. It remains broad county context.
How to use this public-data result
This market time result is a documented context measure for the stated dates and geography. Read it together with the source definition and the table rather than treating the chart as a property-level conclusion.
A current local comparative analysis remains necessary for an individual buying, selling, or pricing decision because this aggregate series does not control for the attributes of a specific home.
Methodology
- Select Redfin county tracker rows for All Residential, 30-day periods and non-seasonally-adjusted values.
- Compare MEDIAN_DOM, Redfin's listing-to-contract median for homes going under contract during the period, for May 2019 and May 2026 for each named county.
- Calculate change as May 2026 median DOM minus May 2019 median DOM; report days rather than a percentage where the result is easier to read.
- Redfin's MEDIAN_DOM excludes listings that were on market for more than one year.
Limitations
- County market time is not a forecast for an individual listing or a city-specific statistic.
- A monthly median can change with composition and provider coverage; it does not identify why homes reached contract sooner or later.
- No claim about bargaining power, pricing strategy, or future days on market is made from this series alone.
- The Redfin archive was retrieved September 29, 2026, but the most recent analyzed monthly observation is May 2026. It is a historical May snapshot, not a current September market reading.
Data and attribution
Original analysis of Redfin Data Center downloads; Redfin county market tracker archive; Redfin Data Center methodology; retrieved September 29, 2026.
- Redfin Data Center downloadsRetrieved 2026-09-29
- Redfin county market tracker archiveRetrieved 2026-09-29
- Redfin Data Center methodologyRetrieved 2026-09-29
Companion article
A May-to-May comparison of Redfin's broad county median listing-to-contract days for homes going under contract.
Read Reading county days on market without overpromising