Takeaway
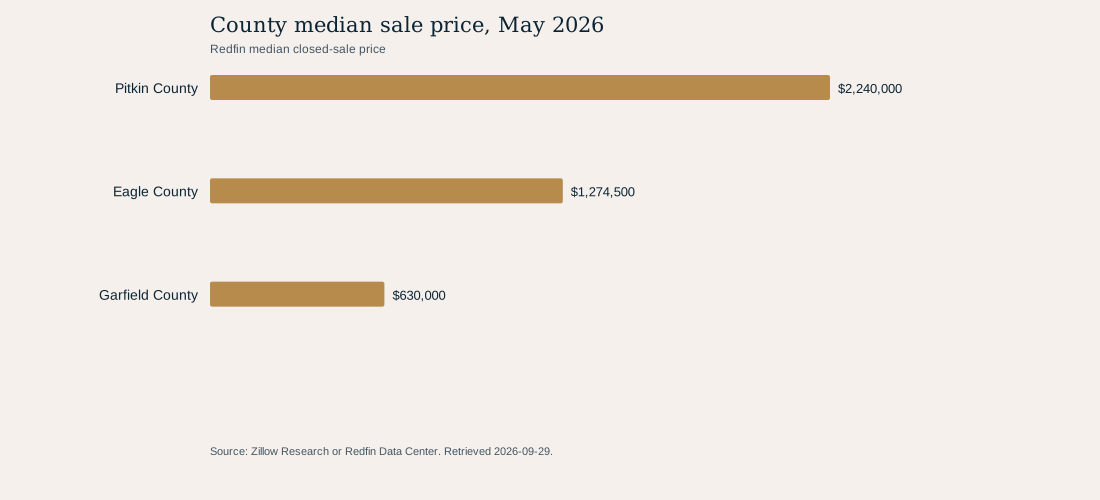
In May 2026, Redfin reported a $2,240,000 median closed-sale price for Pitkin County, compared with $1,250,000 in May 2019. This is broad county context, not an Aspen-only statistic.
Geography
Pitkin, Eagle and Garfield counties, Colorado. Broad county context: these series do not equal Aspen, Snowmass Village, Basalt, Carbondale, or Glenwood Springs city data.
Population
Redfin All Residential county aggregates for Pitkin, Eagle and Garfield counties, Colorado. The comparison uses the two month-end observations per county shown in the table.
Evidence basis
Six county-month observations: three counties × May 2019 and May 2026.
County median sale price, May 2026
Unit: Redfin median closed-sale price
Redfin all-residential median sale price
| County | May 2019 | May 2026 | Change |
|---|---|---|---|
| Pitkin County | $1,250,000 | $2,240,000 | 79.2% |
| Eagle County | $590,000 | $1,274,500 | 116.0% |
| Garfield County | $367,000 | $630,000 | 71.7% |
Price is the median among Redfin's reported closed sales for the broad county and month.
Closed-sale context is broader than a city
Unlike a home-value index, this Redfin field is a median closed-sale price. It reports the midpoint of its observed all-residential county sales for the period.
The tradeoff is geography: Pitkin, Eagle, and Garfield counties include places outside the five city studies. The county results are explicitly a broad context layer, not a substitute for an Aspen or neighborhood median.
How to use this public-data result
This closed sales result is a documented context measure for the stated dates and geography. Read it together with the source definition and the table rather than treating the chart as a property-level conclusion.
A current local comparative analysis remains necessary for an individual buying, selling, or pricing decision because this aggregate series does not control for the attributes of a specific home.
Methodology
- Use Redfin's public county market tracker and retain rows with region type county, property type All Residential, 30-day period, and IS_SEASONALLY_ADJUSTED=false.
- Compare the May 2019 and May 2026 median sale-price fields for each named county.
- Calculate percentage change as May 2026 divided by May 2019 minus one; do not pool county transactions.
Limitations
- County geography is broader than the cities served in this research and must not be written as city-specific evidence.
- A monthly median can move when the mix and number of sales changes; it does not represent every home or every price segment.
- Redfin data are provider data subject to revision. This report does not infer a future sale price, return, or cause of change.
- The Redfin archive was retrieved September 29, 2026, but the most recent analyzed monthly observation is May 2026. It is a historical May snapshot, not a current September market reading.
Data and attribution
Original analysis of Redfin Data Center downloads; Redfin county market tracker archive; Redfin Data Center methodology; retrieved September 29, 2026.
- Redfin Data Center downloadsRetrieved 2026-09-29
- Redfin county market tracker archiveRetrieved 2026-09-29
- Redfin Data Center methodologyRetrieved 2026-09-29
Companion article
Redfin's public county series separates transaction medians from modeled home values.
Read A broad county look at closed-sale medians