Takeaway
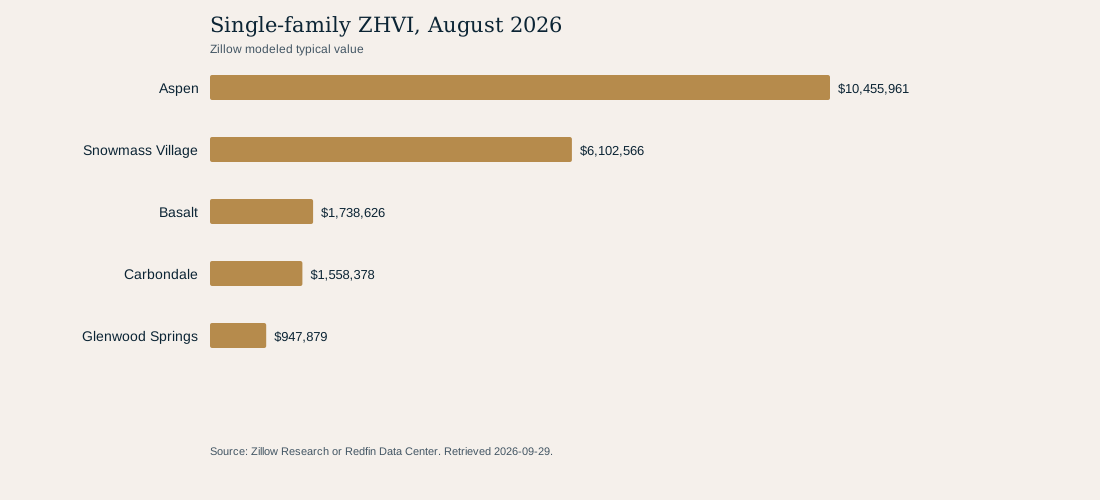
In 2026-08-31, Aspen's single-family ZHVI was $10,455,961, 204.2% above its all-homes ZHVI. Both are Zillow modeled typical values, not sale-price medians.
Geography
Aspen, Snowmass Village, Basalt, Carbondale and Glenwood Springs, Colorado
Population
Zillow modeled city-level typical home-value series for the five named Colorado cities. The comparison uses the endpoint observations shown in the table, not a sample of individual homes.
Evidence basis
10 modeled index observations: five cities × two property groupings, August 2026.
Single-family ZHVI, August 2026
Unit: Zillow modeled typical value
Zillow typical-value series by property grouping
| City | All homes | Single family | SFR relative to all homes |
|---|---|---|---|
| Aspen | $3,437,646 | $10,455,961 | 204.2% |
| Snowmass Village | $2,487,867 | $6,102,566 | 145.3% |
| Basalt | $1,451,260 | $1,738,626 | 19.8% |
| Carbondale | $1,465,714 | $1,558,378 | 6.3% |
| Glenwood Springs | $863,805 | $947,879 | 9.7% |
The difference reflects separate modeled series. It is not a single-family premium holding every property attribute constant.
Property mix belongs in any city comparison
An all-homes city measure mixes the property forms represented in that geography. Zillow also publishes a separate single-family series, which provides a clearer comparison for a household deciding whether to focus on detached homes.
The gap between the two series is descriptive. It does not isolate the effect of being single family because land, size, location, and the underlying homes in the distributions also differ.
How to use this public-data result
This property types result is a documented context measure for the stated dates and geography. Read it together with the source definition and the table rather than treating the chart as a property-level conclusion.
A current local comparative analysis remains necessary for an individual buying, selling, or pricing decision because this aggregate series does not control for the attributes of a specific home.
Methodology
- Select Zillow's seasonally adjusted city all-homes and single-family ZHVI CSVs for the same five cities and August 2026 date.
- Calculate SFR relative to all homes as (SFR ZHVI / all-homes ZHVI) - 1.
- Do not combine values into a valley average or infer a comparable-sale adjustment.
Limitations
- ZHVI is a modeled typical-value measure, not a transaction median or a valuation of a specific property.
- The property groups and local housing mix differ by city. The calculated gap is not a causal single-family premium.
- No condominium series was available from the verified retrieval set, so this report does not make a condo-versus-single-family claim.
Data and attribution
Original analysis of Zillow Research Housing Data; Zillow all-homes city ZHVI CSV; Zillow single-family city ZHVI CSV; retrieved September 29, 2026.
- Zillow Research Housing DataRetrieved 2026-09-29
- Zillow all-homes city ZHVI CSVRetrieved 2026-09-29
- Zillow single-family city ZHVI CSVRetrieved 2026-09-29
Companion article
A property-group comparison using Zillow's August 2026 city-level typical-value series.
Read Why all-homes and single-family series tell different stories