Takeaway
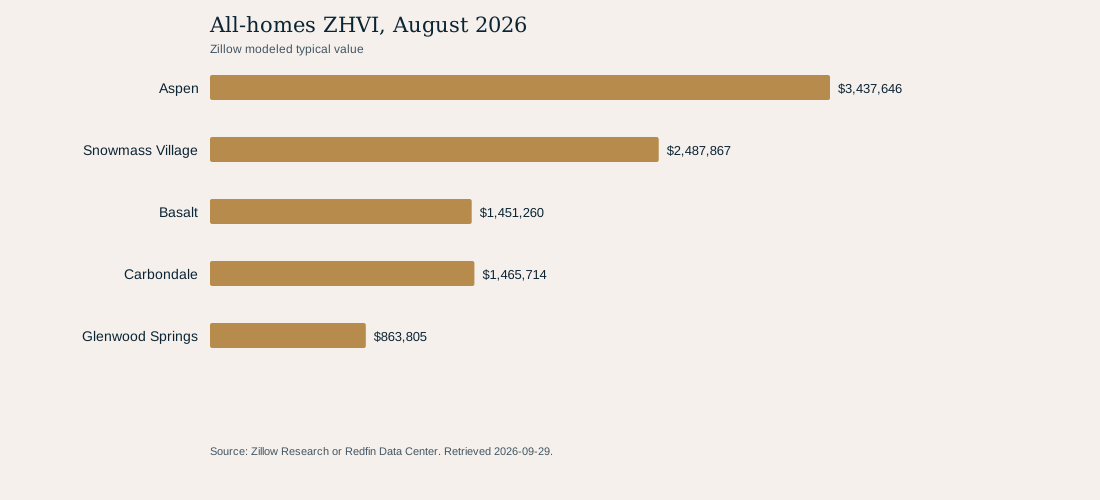
As of 2026-08-31, Aspen's all-homes ZHVI was $3,437,646, 91.7% above January 2019. ZHVI is Zillow's modeled typical home value, not a closed-sale median or an investment return.
Geography
Aspen, Snowmass Village, Basalt, Carbondale and Glenwood Springs, Colorado
Population
Zillow modeled city-level typical home-value series for the five named Colorado cities. The comparison uses the endpoint observations shown in the table, not a sample of individual homes.
Evidence basis
10 endpoint index observations: five cities × January 2019 and August 2026.
All-homes ZHVI, August 2026
Unit: Zillow modeled typical value
All-homes ZHVI change
| City | Jan. 2019 | Aug. 2026 | Change |
|---|---|---|---|
| Aspen | $1,793,507 | $3,437,646 | 91.7% |
| Snowmass Village | $1,021,123 | $2,487,867 | 143.6% |
| Basalt | $721,863 | $1,451,260 | 101.0% |
| Carbondale | $710,120 | $1,465,714 | 106.4% |
| Glenwood Springs | $475,036 | $863,805 | 81.8% |
ZHVI is a modeled typical value. It is not a sale price, appraisal, or return.
A common measure, five distinct paths
Zillow's all-homes series places Aspen at $3,437,646 in August 2026, above Snowmass Village at $2,487,867. Basalt and Carbondale are both near $1.5 million, while Glenwood Springs is below $1 million in this modeled typical-value measure.
The comparison is useful because the same definition and monthly cadence are used across the five city series. It does not remove differences in housing mix, geography, or the kinds of homes captured in each city's data.
How to use this public-data result
This home values result is a documented context measure for the stated dates and geography. Read it together with the source definition and the table rather than treating the chart as a property-level conclusion.
A current local comparative analysis remains necessary for an individual buying, selling, or pricing decision because this aggregate series does not control for the attributes of a specific home.
Methodology
- Use Zillow's seasonally adjusted, smoothed, all-homes mid-tier city ZHVI CSV.
- For each city, calculate percentage change as (2026-08-31 ZHVI / 2019-01-31 ZHVI) - 1.
- Publish only the five named city series and the aggregate calculation table.
Limitations
- ZHVI estimates a typical home value for the middle portion of the value distribution. It is not the median price of homes that sold in a month, a list price, or a valuation of any individual property.
- City boundaries and housing mix differ. A comparison does not control for property type, size, condition, or location within a city.
- Public data are revised by the provider; this report is a dated extraction, not a forecast.
Data and attribution
Original analysis of Zillow Research Housing Data; Zillow all-homes city ZHVI CSV; retrieved September 29, 2026.
- Zillow Research Housing DataRetrieved 2026-09-29
- Zillow all-homes city ZHVI CSVRetrieved 2026-09-29
Companion article
A five-city reading of Zillow's modeled typical home values through August 2026.
Read Aspen-area typical home values since 2019