Takeaway
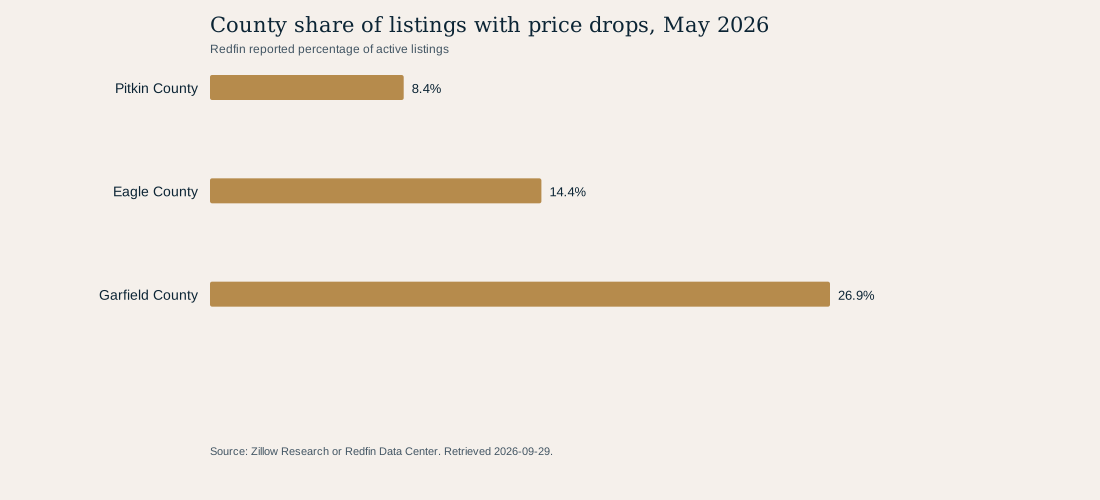
In May 2026, Redfin reported price drops on 8.4% of active all-residential listings in Pitkin County. The result is broad county listing context, not a recommendation to reduce a specific Aspen listing.
Geography
Pitkin, Eagle and Garfield counties, Colorado. Broad county context, not city- or listing-specific reduction guidance.
Population
Redfin All Residential county aggregates for Pitkin, Eagle and Garfield counties, Colorado. The comparison uses the two month-end observations per county shown in the table.
Evidence basis
Six county-month observations: three counties × May 2024 and May 2026.
County share of listings with price drops, May 2026
Unit: Redfin reported percentage of active listings
Redfin reported price-drop share
| County | May 2024 | May 2026 | Change |
|---|---|---|---|
| Pitkin County | 5.9% | 8.4% | +2.5 percentage points |
| Eagle County | 10.5% | 14.4% | +3.9 percentage points |
| Garfield County | 32.8% | 26.9% | -5.9 percentage points |
Price drops is Redfin's share of active listings with at least a 1% and no more than a 50% price reduction. Earlier coverage was incomplete for two counties, so the report begins in May 2024.
A listing behavior measure, not a price instruction
A price-drop share describes reported listing behavior in a broad county. It does not measure how far asking prices moved or whether a specific property should change its price.
This report begins in May 2024 because the verified Redfin fields before that date are incomplete for two of the three counties. The date boundary preserves comparable coverage rather than inserting missing values.
How to use this public-data result
This price reductions result is a documented context measure for the stated dates and geography. Read it together with the source definition and the table rather than treating the chart as a property-level conclusion.
A current local comparative analysis remains necessary for an individual buying, selling, or pricing decision because this aggregate series does not control for the attributes of a specific home.
Methodology
- Select Redfin county tracker rows for All Residential, 30-day periods and non-seasonally-adjusted values.
- Use PRICE_DROPS for May 2024 and May 2026. Begin in May 2024 because earlier fields are incomplete for Pitkin and Garfield counties.
- Calculate percentage-point change as May 2026 share minus May 2024 share; do not treat missing values as zero.
- Redfin defines price drops as active listings with at least a 1% and no more than a 50% price reduction; the field is a share of active listings.
Limitations
- The share indicates whether a listing had a reduction, not the amount of the reduction or the final sale result.
- Results are broad county context and cannot support a city-specific or individual-property pricing recommendation.
- No causal claim is made about why sellers reduced prices, and no negotiating-power conclusion is inferred from this one metric.
- The Redfin archive was retrieved September 29, 2026, but the most recent analyzed monthly observation is May 2026. It is a historical May snapshot, not a current September market reading.
Data and attribution
Original analysis of Redfin Data Center downloads; Redfin county market tracker archive; Redfin Data Center methodology; retrieved September 29, 2026.
- Redfin Data Center downloadsRetrieved 2026-09-29
- Redfin county market tracker archiveRetrieved 2026-09-29
- Redfin Data Center methodologyRetrieved 2026-09-29
Companion article
A transparent May 2024 to May 2026 county comparison of Redfin's reported listing price reductions.
Read Price-drop shares are context, not a pricing instruction