Takeaway
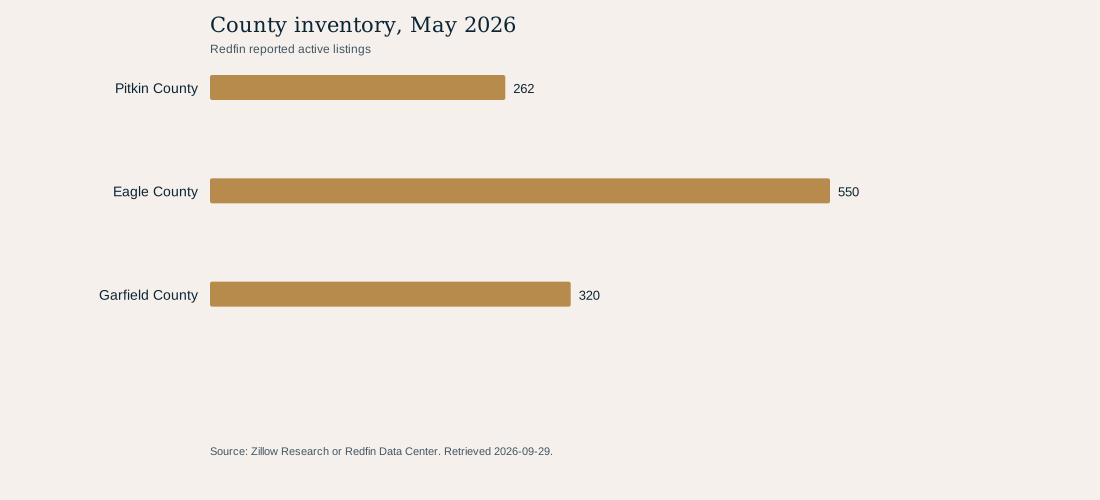
Redfin reported 262 all-residential homes for sale on the final day of the period in Pitkin County in May 2026, 33.0% below May 2019. This is broad county supply context, not an Aspen city inventory count.
Geography
Pitkin, Eagle and Garfield counties, Colorado. Broad county context, explicitly separate from city-specific inventory.
Population
Redfin All Residential county aggregates for Pitkin, Eagle and Garfield counties, Colorado. The comparison uses the two month-end observations per county shown in the table.
Evidence basis
Six county-month observations: three counties × May 2019 and May 2026.
County inventory, May 2026
Unit: Redfin reported active listings
Redfin reported active inventory
| County | May 2019 | May 2026 | Change |
|---|---|---|---|
| Pitkin County | 391 | 262 | -33.0% |
| Eagle County | 956 | 550 | -42.5% |
| Garfield County | 467 | 320 | -31.5% |
Inventory is Redfin's count of homes for sale on the final day of the period, excluding listings more than one year old; it is not the ACTIVE_LISTINGS field.
Supply requires its own measure
Inventory counts describe listings available in a period. They are not sales, demand, or a measure of value. This county report treats supply as a distinct signal rather than trying to infer it from prices.
The counts are broad county data and can be influenced by the county's coverage and property mix. They should not be used to claim the number of active listings in any city or resort submarket.
How to use this public-data result
This supply result is a documented context measure for the stated dates and geography. Read it together with the source definition and the table rather than treating the chart as a property-level conclusion.
A current local comparative analysis remains necessary for an individual buying, selling, or pricing decision because this aggregate series does not control for the attributes of a specific home.
Methodology
- Select Redfin county tracker rows for All Residential, 30-day periods and non-seasonally-adjusted values.
- Compare reported INVENTORY in May 2019 and May 2026 for the three named counties.
- Calculate each change separately. No county total is created because it would double the geographic question rather than answer a city-level supply question.
- Redfin defines INVENTORY as homes for sale on the final day of the period and excludes listings more than one year old. It is distinct from ACTIVE_LISTINGS, which counts homes active at any time in the period.
Limitations
- Broad counties contain multiple markets. Results are not Aspen-, Snowmass Village-, Basalt-, Carbondale-, or Glenwood Springs-specific inventory counts.
- Inventory is a point-in-time listing measure and can change with new listings, pending activity, delistings, and provider coverage.
- The report does not assert buyer/seller leverage, absorption, or a pricing recommendation from inventory alone.
- The Redfin archive was retrieved September 29, 2026, but the most recent analyzed monthly observation is May 2026. It is a historical May snapshot, not a current September market reading.
Data and attribution
Original analysis of Redfin Data Center downloads; Redfin county market tracker archive; Redfin Data Center methodology; retrieved September 29, 2026.
- Redfin Data Center downloadsRetrieved 2026-09-29
- Redfin county market tracker archiveRetrieved 2026-09-29
- Redfin Data Center methodologyRetrieved 2026-09-29
Companion article
Redfin's public active-listing counts for Pitkin, Eagle, and Garfield counties through May 2026.
Read What broad county inventory can and cannot tell us