Takeaway
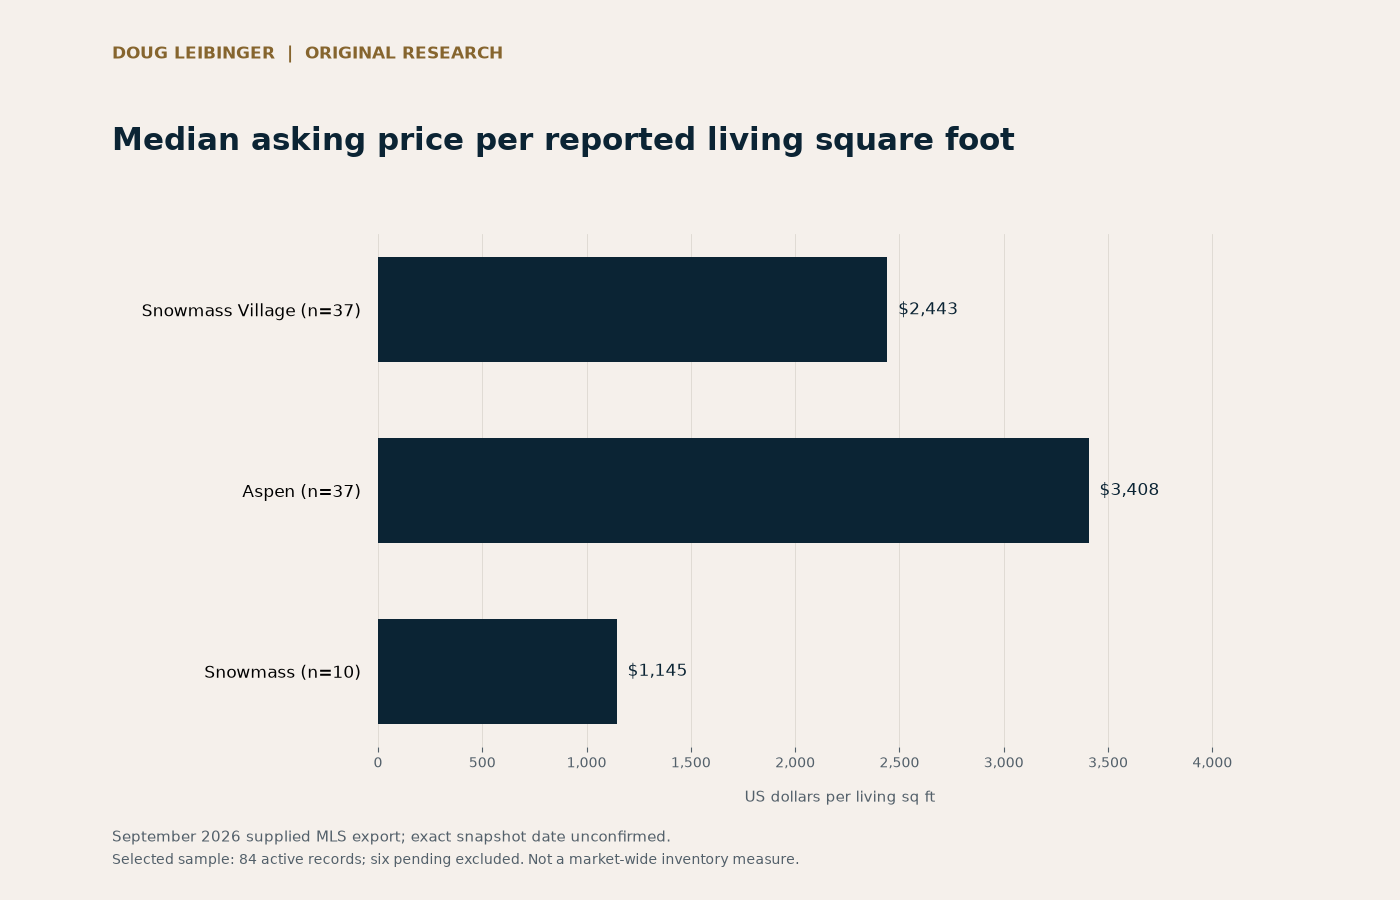
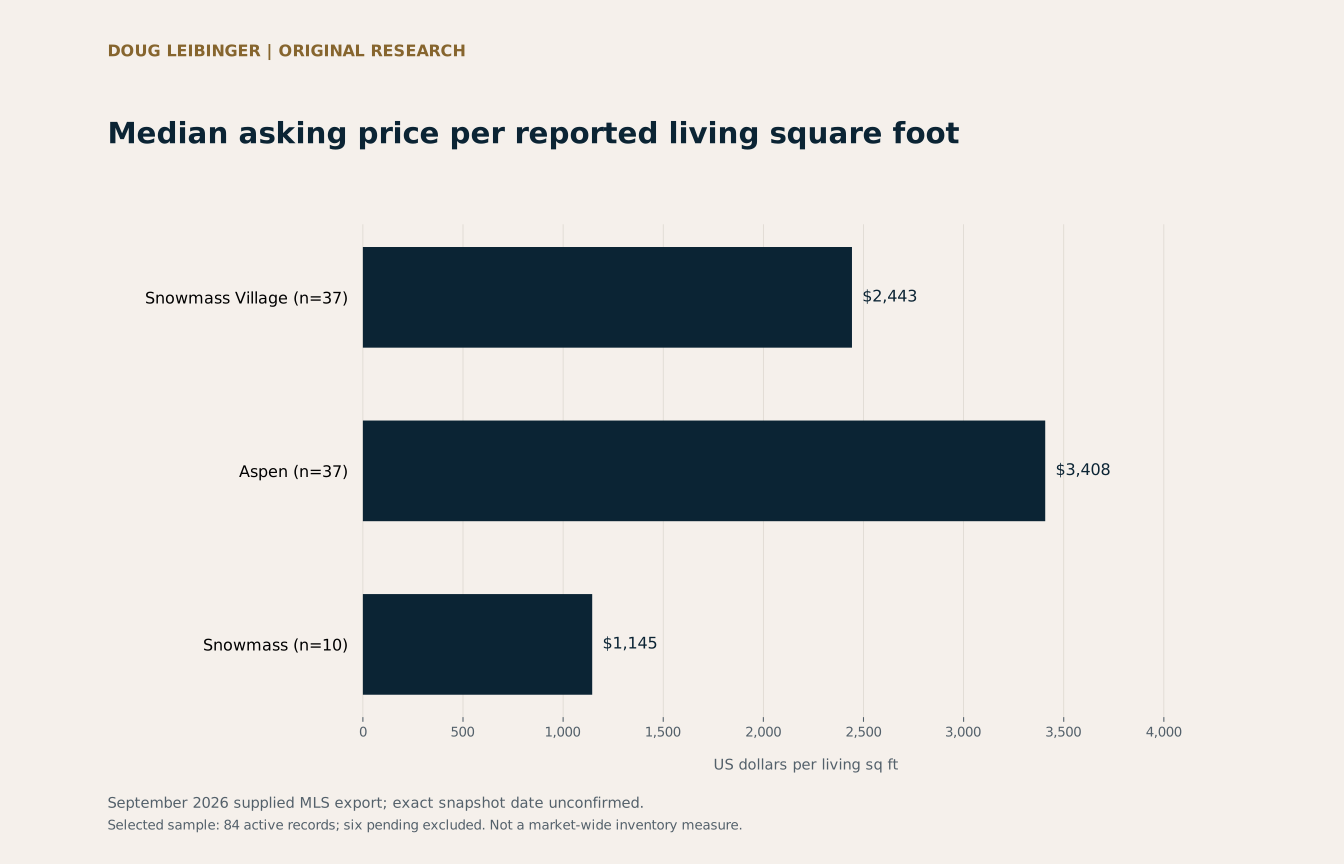
Median listing-level asking ratios are $3,408 per living sq ft in Aspen, $2,443 in Snowmass Village and $1,145 in the Snowmass group. Property mix differs.
Geography
Aspen, Snowmass Village and Snowmass (Old Snowmass), Colorado
Population
84 active records selected from a 90-record supplied export; six pending records excluded. Observed active asking prices: $2.05M–$4.995M. Selection criteria were not supplied.
Study sample
84 selected records
Median asking price per reported living square foot
Unit: US dollars per living sq ft
Location-level living-area and asking-ratio summaries
| Location | Valid pairs | Median living sq ft | Median asking $/living sq ft | Middle 50% asking $/living sq ft |
|---|---|---|---|---|
| Snowmass Village | 37 | 1,238 | $2,443 | $1,978–$2,690 |
| Aspen | 37 | 941 | $3,408 | $2,847–$4,033 |
| Snowmass | 10 | 2,924.5 | $1,145 | $986–$1,832 |
Denominator: positive Lv Ht SqFt. This field equals Total SqFt in all 84 eligible records, but the fields are not assumed interchangeable in other data.
Calculate the ratio at the listing level
The study divides each eligible record's asking price by its positive reported living area, then summarizes those individual ratios. That procedure differs from dividing a group's median asking price by its median living area. The latter can describe two different properties and is not used as a substitute.
Reported living area is the denominator throughout. Total building area, garage area, lot area and outdoor deck or patio area are not interchangeable. The analysis preserves the source field choice so a reader can understand what the ratio measures.
Size and location remain intertwined
The supplied selection contains different property forms and sizes across Aspen, Snowmass Village and Snowmass. Grouped asking-price ratios are descriptive summaries of those choices. They do not measure an isolated location effect, construction cost or a price premium attributable to extra space.
A high or low ratio is best used as a prompt for investigation. The next comparison should consider the floor plan, property form, condition and supporting area documentation. The export cannot establish whether a reported area is accurate or whether one square foot in two different homes offers equivalent usefulness.
Methodology
- Source: an MLS export supplied for Doug Leibinger’s research. The analysis uses 84 rows with Status=A and excludes six rows with Status=P; there are no duplicate listing IDs.
- Divide each positive Asking Price by positive Lv Ht SqFt; all 84 records qualify. Summarize listing ratios by City/Town. Quartiles use linear interpolation at index (n−1)×p.
- Medians use the middle ordered value, or the average of the two middle values. Counts may be shown for small categories, but no price, size or fee statistic is published for a group under five. Percentages may not sum to exactly 100% because of rounding.
Limitations
- This is a selected sample, not a market-wide inventory count or a random sample. No sale prices, appreciation, absorption, causal premiums or forecast are inferred.
- The filename says September 22, but 13 records have later modification dates. The research does not claim a confirmed September 22 snapshot; publication on September 28 is a separate date.
- Listing fields are reported information. Availability, property rights, condition, costs and individual source values have not been independently verified for this research.
Data and attribution
Original analysis published by Doug Leibinger from a user-supplied MLS export. Listing fields were reported by participating brokers; the private source file is not redistributed.
Download aggregate CSVDownload chart (PNG)Download chart (SVG)
Companion article
Use original Aspen-area MLS research to compare reported living area and asking-price ratios without mistaking a screening metric for a valuation.
Read Aspen Asking Price per Square Foot: Beyond the Ratio