Takeaway
The selected active records have a median 106 days on market. Thirty-one of 84 report more than 180 days, without establishing seller motivation or time to sale.
Geography
Aspen, Snowmass Village and Snowmass (Old Snowmass), Colorado
Population
84 active records selected from a 90-record supplied export; six pending records excluded. Observed active asking prices: $2.05M–$4.995M. Selection criteria were not supplied.
Study sample
84 selected records
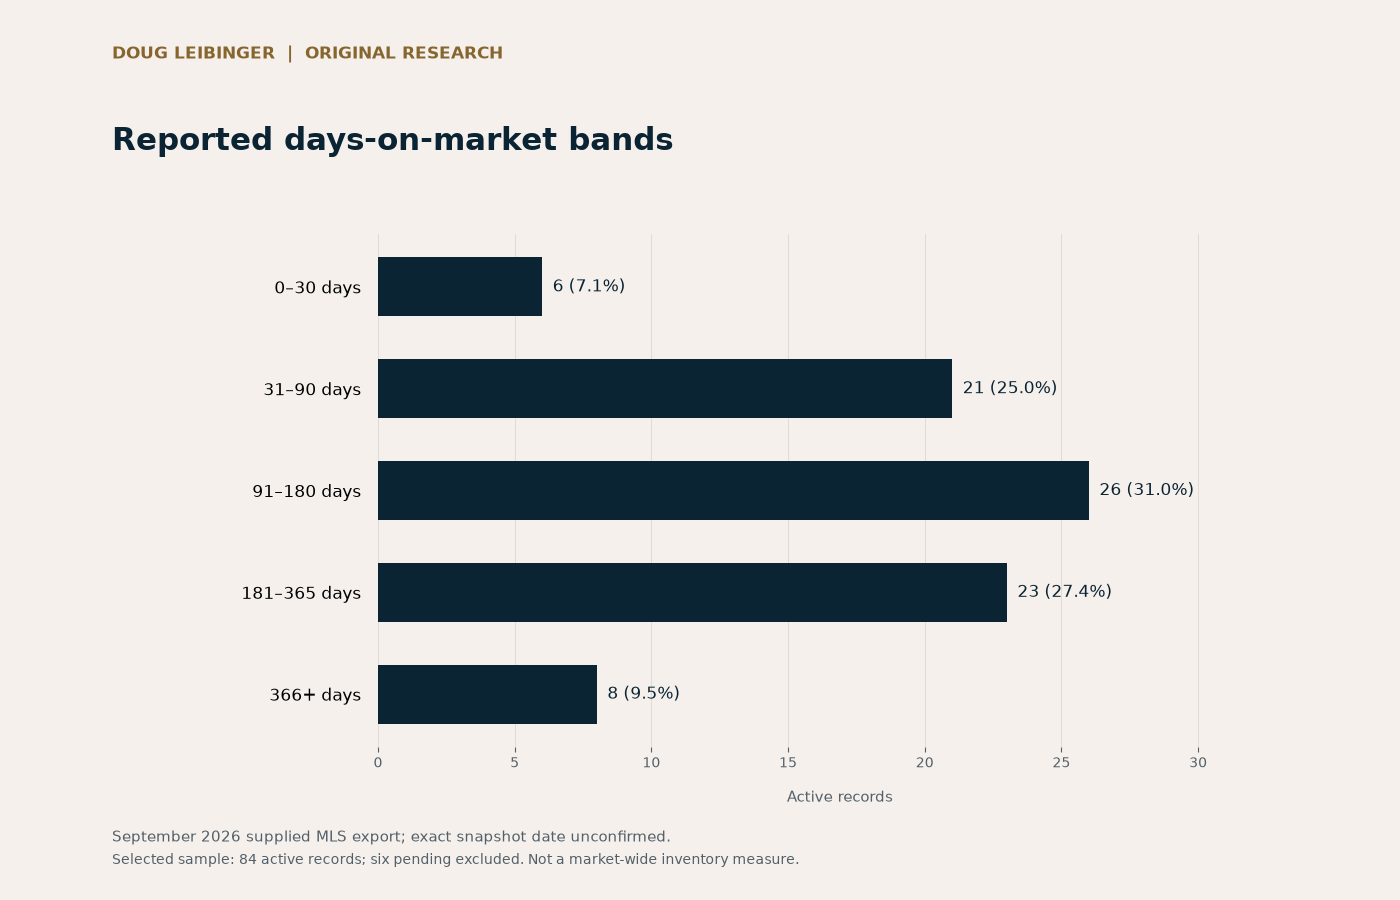
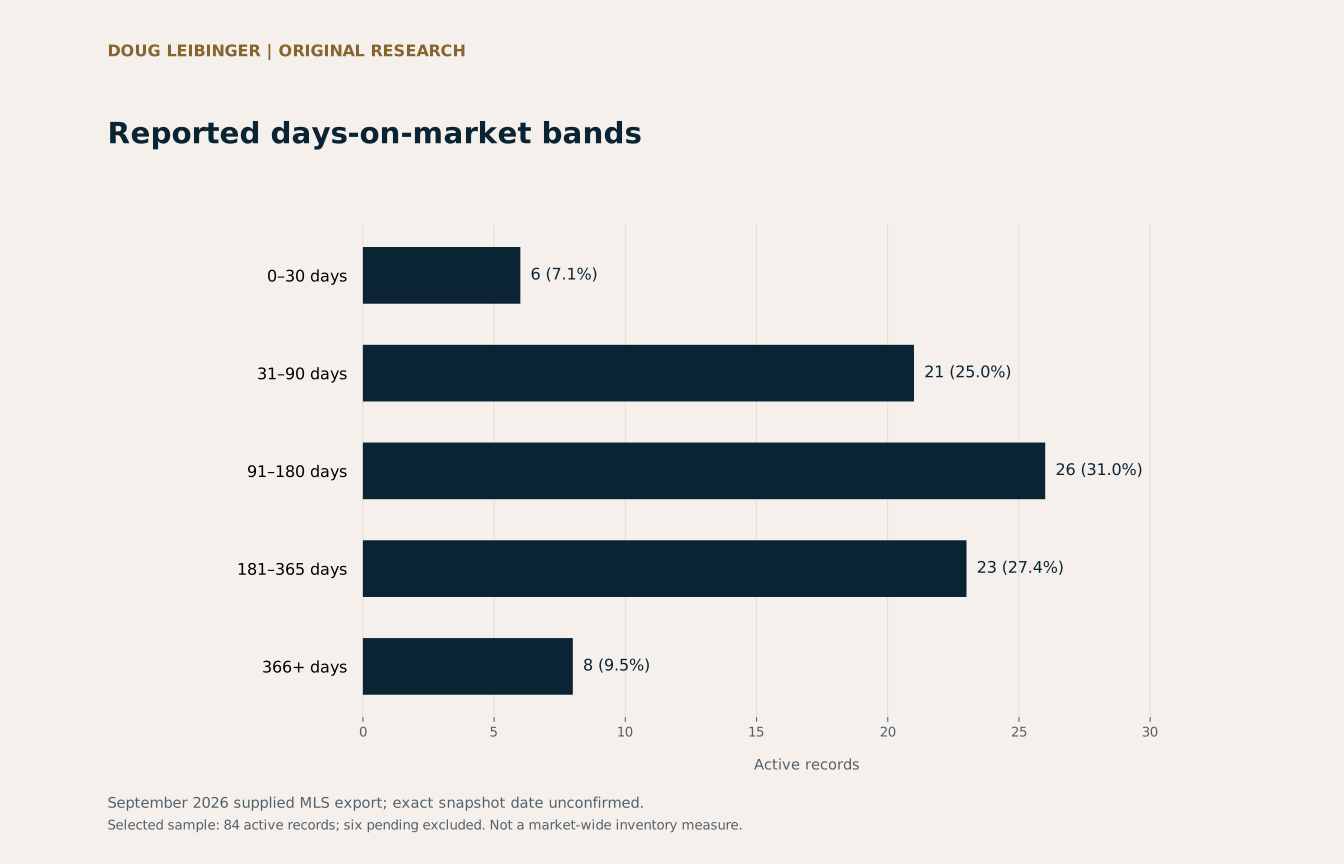
Reported days-on-market bands
Unit: Active records
Reported exposure bands
| Days on market | Active records | Share of 84 |
|---|---|---|
| 0–30 days | 6 | 7.1% |
| 31–90 days | 21 | 25.0% |
| 91–180 days | 26 | 31.0% |
| 181–365 days | 23 | 27.4% |
| 366+ days | 8 | 9.5% |
Median 106 days; middle 50%: 76.5–263.75 days. Active exposure is not completed time to sale.
Exposure, not a forecast
The supplied active sample has a median 106 days on market, with the middle half spanning 76.5 to 263.75 days. Six listings fall in the 0-30-day band, 21 in 31-90, 26 in 91-180, 23 in 181-365, and eight at 366 or more days. Those counts describe listing exposure in this selected export only. They do not establish buyer demand, likelihood of sale, time to contract, or the reason any property remains available. The file name says September 22, while many listing-date-plus-DOM combinations point later; use DOM as supplied rather than attaching a confirmed as-of date.
Why this is not a time-to-sale study
Thirty-one records fall above 180 days, combining the 181–365 and 366-plus groups. Their presence shows that longer exposure exists within the selected active sample. It does not reveal the eventual outcome of those listings or the corresponding distribution among homes that have already sold.
The research retains the reported field instead of recalculating exposure from calendar dates. Listing-date-plus-DOM checks do not agree on a single date for every record, and the export does not document how pauses or other listing events affect the field.
Methodology
- Source: an MLS export supplied for Doug Leibinger’s research. The analysis uses 84 rows with Status=A and excludes six rows with Status=P; there are no duplicate listing IDs.
- Use reported Days on Market without recalculating from dates. All 84 values are nonnegative. Bands are inclusive at the displayed endpoints; the final band begins at 366.
- Medians use the middle ordered value, or the average of the two middle values. Counts may be shown for small categories, but no price, size or fee statistic is published for a group under five. Percentages may not sum to exactly 100% because of rounding.
Limitations
- This is a selected sample, not a market-wide inventory count or a random sample. No sale prices, appreciation, absorption, causal premiums or forecast are inferred.
- The filename says September 22, but 13 records have later modification dates. The research does not claim a confirmed September 22 snapshot; publication on September 28 is a separate date.
- Listing fields are reported information. Availability, property rights, condition, costs and individual source values have not been independently verified for this research.
Data and attribution
Original analysis published by Doug Leibinger from a user-supplied MLS export. Listing fields were reported by participating brokers; the private source file is not redistributed.
Download aggregate CSVDownload chart (PNG)Download chart (SVG)
Companion article
A selected 84-listing sample has a median 106 days on market. Learn what listing exposure can tell you, and which questions still need property-level evidence.
Read Reading Days on Market in an Aspen-Area Home Search