Takeaway
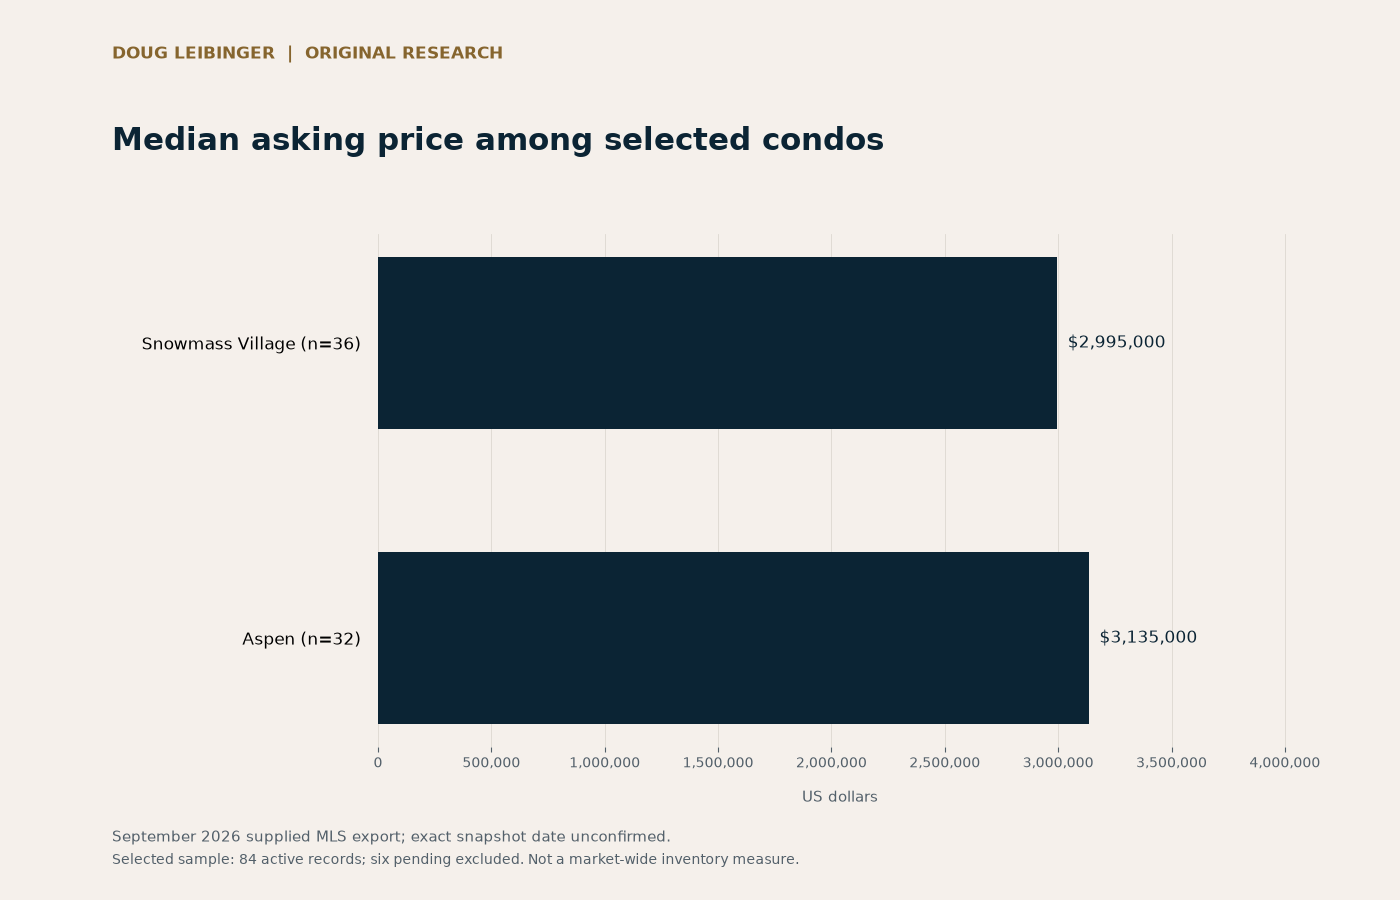
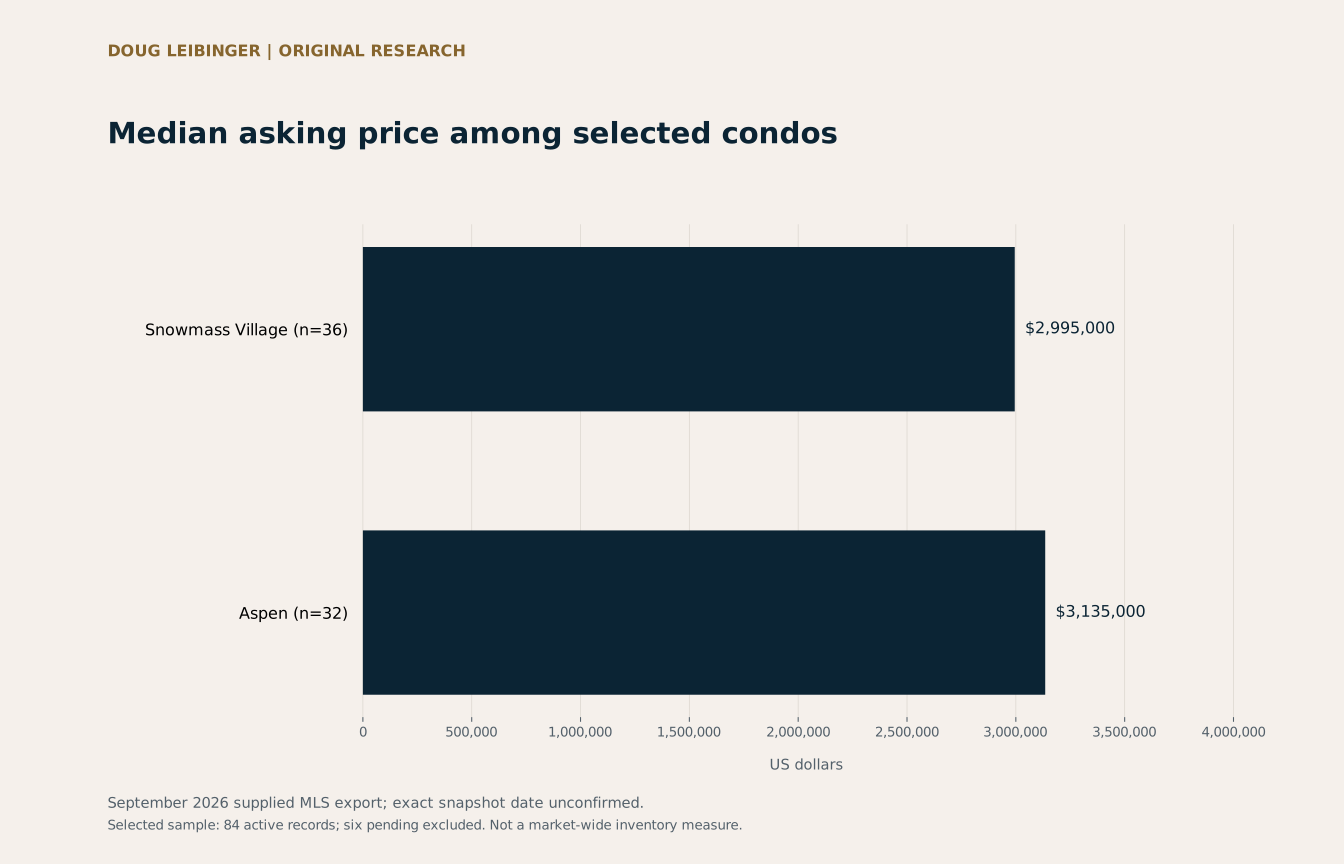
The 32 selected Aspen condos have a median asking price of $3,135,000 and median living area of 912 sq ft; the 36 Snowmass Village condos show $2,995,000 and 1,238 sq ft.
Geography
Aspen, Snowmass Village and Snowmass (Old Snowmass), Colorado
Population
84 active records selected from a 90-record supplied export; six pending records excluded. Observed active asking prices: $2.05M–$4.995M. Selection criteria were not supplied.
Study sample
68 selected records
Median asking price among selected condos
Unit: US dollars
Active records labeled Condominium
| Location | Records | Median ask | Median living sq ft | Median asking $/living sq ft |
|---|---|---|---|---|
| Snowmass Village | 36 | $2,995,000 | 1,238 | $2,485 |
| Aspen | 32 | $3,135,000 | 912 | $3,539 |
68 condo records: 32 Aspen and 36 Snowmass Village. Ratios are calculated per listing before taking the median.
Holding the reported property form constant
This study narrows the active selection to records labeled Condominium before comparing locations. That removes the most obvious condo-versus-detached-home mixture from the location comparison. It still does not control for building, condition, floor level, view, amenities or the legal characteristics of each unit.
The sample's observed asking-price window further limits interpretation. A lower or higher condo median here says something about the condos selected for this export. It does not establish a comprehensive price difference between Aspen and Snowmass Village.
Read the separate measures as a set
Listing counts show how much evidence supports each row. Median asking price describes the middle price; median reported living area describes the middle size; the median of individual asking-price-per-living-square-foot ratios describes another distribution. The ratio of the two medians is not substituted for the median listing ratio.
Together, those measures help frame the tradeoff a buyer should test in actual buildings. A seller can use them to identify the questions a competitor comparison needs to answer. They cannot explain why two units are priced differently or isolate a dollar premium for one location.
Methodology
- Source: an MLS export supplied for Doug Leibinger’s research. The analysis uses 84 rows with Status=A and excludes six rows with Status=P; there are no duplicate listing IDs.
- Filter Book Section=Condominium: 68 records, comprising 32 Aspen and 36 Snowmass Village. Calculate each listing ratio before the location median.
- Medians use the middle ordered value, or the average of the two middle values. Counts may be shown for small categories, but no price, size or fee statistic is published for a group under five. Percentages may not sum to exactly 100% because of rounding.
Limitations
- This is a selected sample, not a market-wide inventory count or a random sample. No sale prices, appreciation, absorption, causal premiums or forecast are inferred.
- The filename says September 22, but 13 records have later modification dates. The research does not claim a confirmed September 22 snapshot; publication on September 28 is a separate date.
- Listing fields are reported information. Availability, property rights, condition, costs and individual source values have not been independently verified for this research.
Data and attribution
Original analysis published by Doug Leibinger from a user-supplied MLS export. Listing fields were reported by participating brokers; the private source file is not redistributed.
Download aggregate CSVDownload chart (PNG)Download chart (SVG)
Companion article
Compare selected Aspen and Snowmass Village condos using living area, asking price and operating documents, with original September 2026 research.
Read Comparing Aspen and Snowmass Village Condos Within One Budget