Takeaway
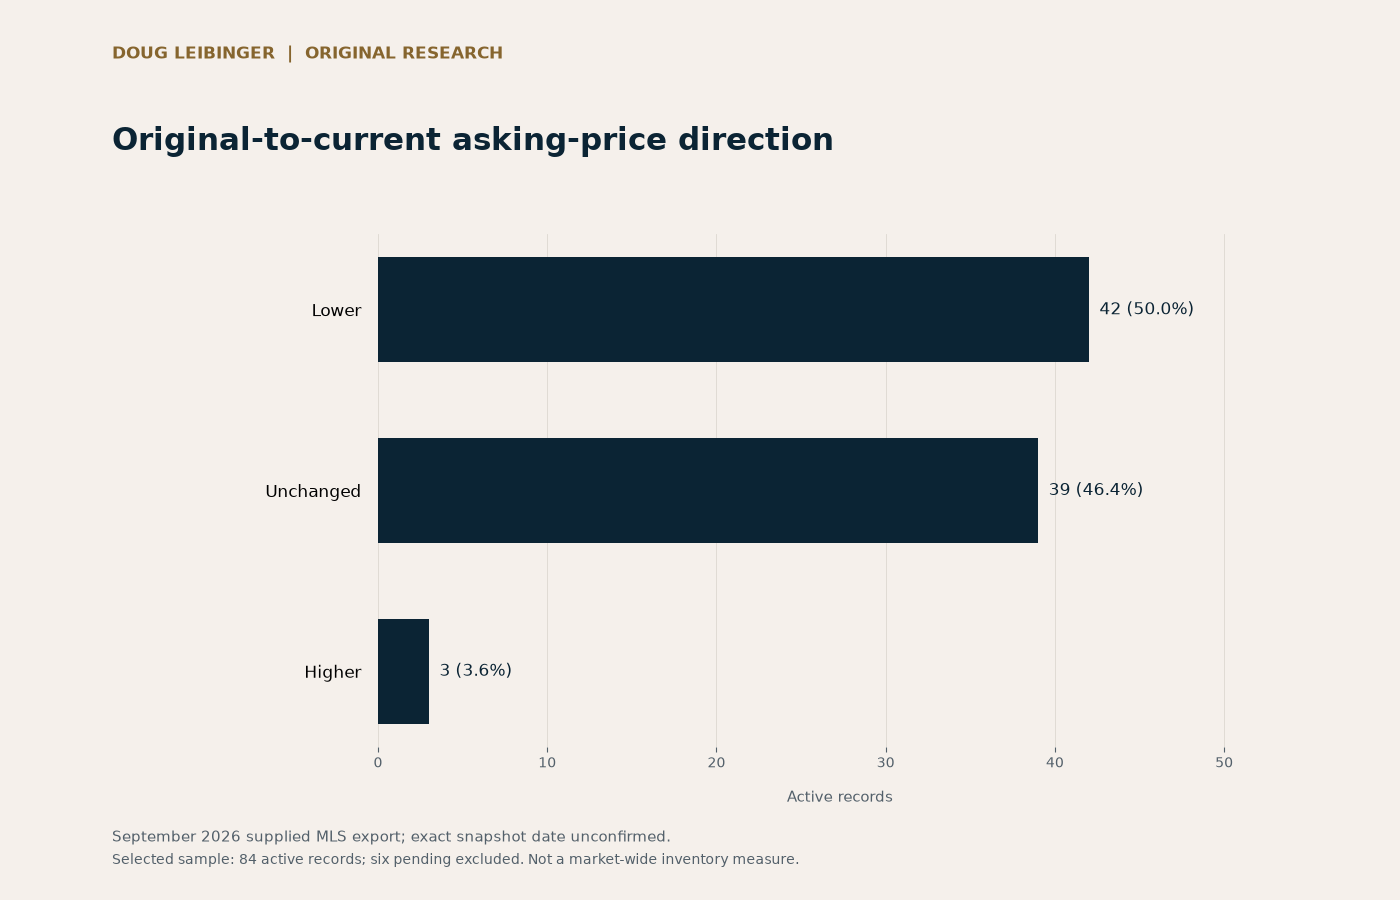
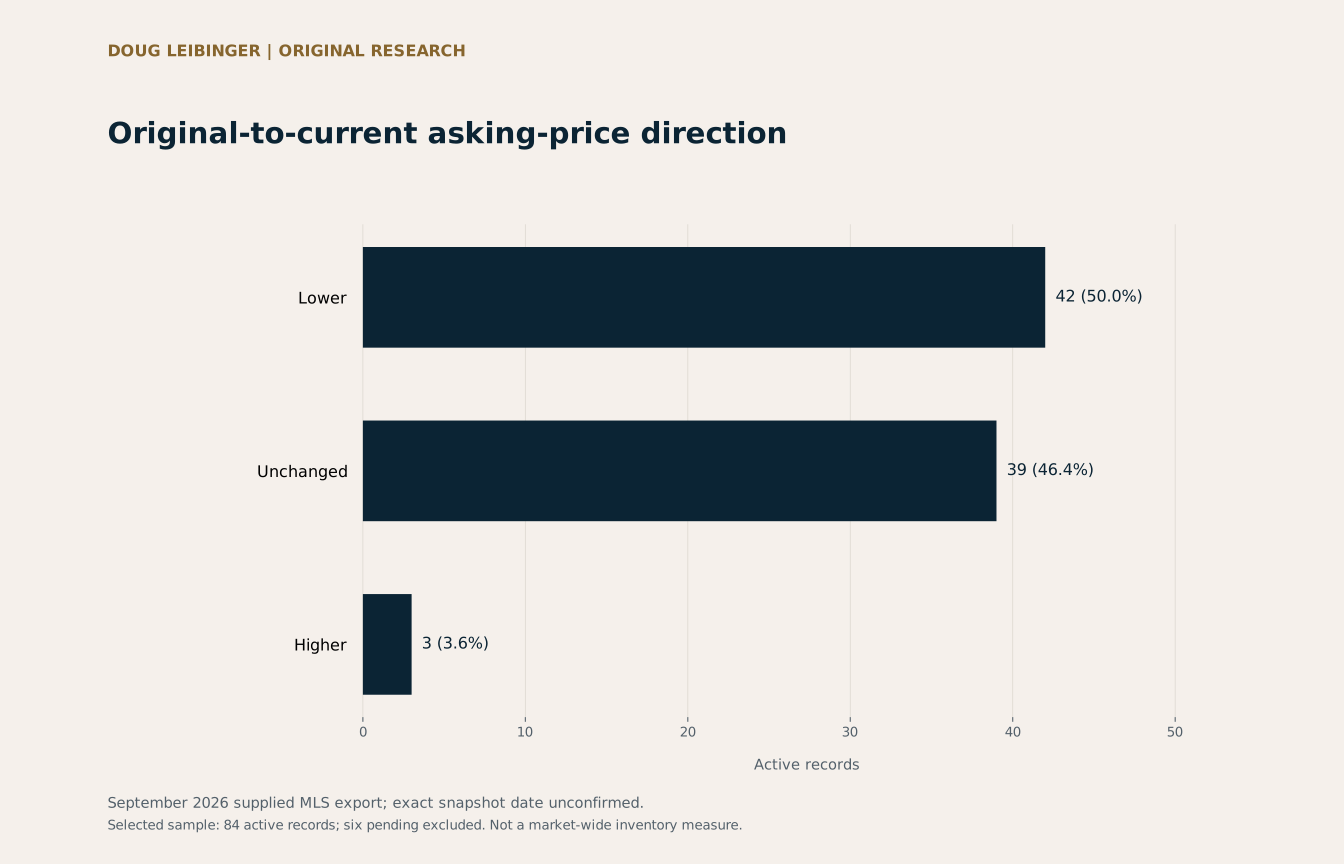
Half the active sample, 42 of 84 records, asks less than the original price. The median reduction among those 42 is 6.5%, or 6.3% excluding one extreme entry.
Geography
Aspen, Snowmass Village and Snowmass (Old Snowmass), Colorado
Population
84 active records selected from a 90-record supplied export; six pending records excluded. Observed active asking prices: $2.05M–$4.995M. Selection criteria were not supplied.
Study sample
84 selected records
Original-to-current asking-price direction
Unit: Active records
Original versus current asking price
| Direction | Active records | Share of 84 |
|---|---|---|
| Lower | 42 | 50.0% |
| Unchanged | 39 | 46.4% |
| Higher | 3 | 3.6% |
Direction uses all 84 valid pairs. Counts may be below five; small-group price statistics are not published.
Median reduction among reduced records
| Cohort | Reduced records | Median reduction | Largest reduction |
|---|---|---|---|
| All reported reductions | 42 | 6.5% | 90.0% |
| Without the extreme original-price entry | 41 | 6.3% | 21.2% |
Sensitivity excludes the single pair with original ask at least $10M and current ask at most $5M: $39M to $3.9M. The exclusion is a sensitivity test, not a correction of the source.
Two price fields measure a listing change
Forty-two of the 84 active records have an asking price below the Original List Price field. The measure compares two fields within the supplied record. It does not reconstruct every intermediate adjustment, the date of a change, a prior listing history or a completed transaction.
For each reduced record, the percentage reduction is calculated as original asking price minus current asking price, divided by original asking price. The median across reduced records is about 6.5%. Unchanged and increased records are counted separately rather than included as zero reductions in that median.
An extreme original-price entry requires visibility
One record reports a $39 million original price and a $3.9 million current ask, producing a 90% decrease. The source does not establish whether that represents a genuine price history or an input error. The study retains the reported observation and shows a sensitivity calculation without the extreme entry instead of silently correcting it.
The resulting evidence supports a statement about asking-price revisions in this selected active sample. It does not show discounts negotiated by buyers, seller motivation, declining property values or a rate of market-wide price cutting. Those questions need additional time-series or transaction evidence.
Methodology
- Source: an MLS export supplied for Doug Leibinger’s research. The analysis uses 84 rows with Status=A and excludes six rows with Status=P; there are no duplicate listing IDs.
- Compare Original List Price with Asking Price across 84 positive price pairs. Reduction percentage=(original−current)/original×100. The reduction median uses only reduced records, not the entire sample.
- Retain all entries in the main result. A sensitivity test excludes the single original≥$10M/current≤$5M pair, leaving 41 reduced records and 83 total records.
- Medians use the middle ordered value, or the average of the two middle values. Counts may be shown for small categories, but no price, size or fee statistic is published for a group under five. Percentages may not sum to exactly 100% because of rounding.
Limitations
- This is a selected sample, not a market-wide inventory count or a random sample. No sale prices, appreciation, absorption, causal premiums or forecast are inferred.
- The filename says September 22, but 13 records have later modification dates. The research does not claim a confirmed September 22 snapshot; publication on September 28 is a separate date.
- Listing fields are reported information. Availability, property rights, condition, costs and individual source values have not been independently verified for this research.
Data and attribution
Original analysis published by Doug Leibinger from a user-supplied MLS export. Listing fields were reported by participating brokers; the private source file is not redistributed.
Download aggregate CSVDownload chart (PNG)Download chart (SVG)
Companion article
Half the active records in this supplied sample ask less than their original price. Learn what that measures, the data checks involved and how to use it.
Read What an Aspen-Area Asking-Price Reduction Can Tell You