Takeaway
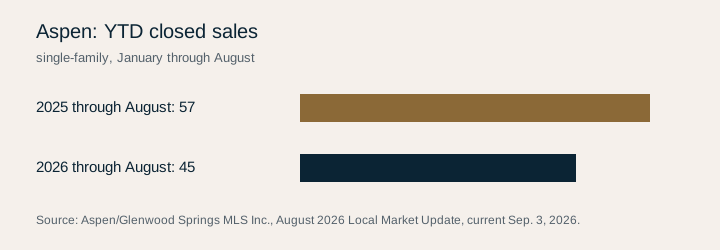
Aspen single-family closed sales fell from 57 to 45 in January-August 2026 versus the same 2025 period, while days on market until sale rose from 157 to 242. August inventory also fell, from 120 to 103 homes.
Geography
Aspen, Colorado
Population
Aspen/Glenwood Springs MLS aggregate single-family metrics for Aspen; 45 closed sales in Jan-Aug 2026.
Evidence basis
Official MLS aggregate closed-sales report: 45 Aspen single-family sales, January through August 2026.
Year-to-date sold listings
Unit: Closed sales
Matching January-August closed-sales metrics
| Metric | 2025 YTD | 2026 YTD | Change |
|---|---|---|---|
| Sold listings | 57 | 45 | -21.1% |
| Median sales price | $13,000,000 | $9,500,000 | -26.9% |
| Days on market until sale | 157 | 242 | 54.1% |
| New listings | 143 | 131 | -8.4% |
Compare January through August 2025 with January through August 2026. Source notes price does not account for seller concessions and/or down payment assistance.
August supply context
| Metric | August 2025 | August 2026 | Change |
|---|---|---|---|
| Inventory of homes for sale | 120 | 103 | -14.2% |
| Months supply of inventory | 18.0 | 16.5 | -8.3% |
August point-in-time measures, not year-to-date totals.
Derived findings
The completed-sales count decreased by 12 (45 minus 57). Reported days on market increased by 85 (242 minus 157). The median-price difference was negative $3.5 million, equivalent to a 26.9% reduction relative to the 2025 median.
Inventory decreased by 17 listings in the August comparison, despite the longer year-to-date marketing-time statistic. The two measures describe different populations and time windows. Their directions should be reported separately.
What this comparison establishes
The analysis compares the published January-August 2025 and January-August 2026 aggregates for Aspen, Colorado, using the property category shown in the tables. Inventory and months supply retain their separate August reporting frame.
The public PDF supplies aggregate results rather than the underlying transaction file. It supports reproducible arithmetic and descriptive comparisons. It does not support a causal explanation, a like-for-like appreciation estimate or an address-specific value. The companion article develops the practical questions raised by these findings.
Methodology
- Use the official Aspen/Glenwood Springs MLS Inc. August 2026 Local Market Update, current September 3, 2026.
- Transcribe the named geography and property-form table. Compare its January-through-August 2025 and 2026 values.
- Calculate displayed percentage changes as (2026 minus 2025) divided by 2025, rounded to one decimal. Retain the report's separate August inventory and months-supply measures.
Limitations
- This is an aggregate public MLS report, not an appraisal, forecast, causal analysis, or full Roaring Fork market measure.
- Median prices do not account for seller concessions and/or down payment assistance, as stated in the source.
- One month can look extreme due to small sample size, as noted by the source. Inventory is an August snapshot while sales values are year-to-date.
Data and attribution
Original analysis of Aspen/Glenwood Springs MLS Inc. data in the Colorado Association of REALTORS Local Market Update. August 2026 reports current September 3, 2026; underlying reports © 2026 ShowingTime Plus, LLC.
- Aspen August 2026 Local Market Update PDFRetrieved 2026-09-29
Companion article
Aspen single-family closed sales fell from 57 to 45 in January-August 2026 versus the same 2025 period, while days on market until sale rose from 157 to 242. August inventory also fell, from 120 to 103 homes.
Read Aspen single-family sales slowed while August inventory fell